
GAMEBREAKING

Unlocking the data behind a videogame's success
A crowded market
Steam’s growth over the past decade has been staggering. In 2023 alone, over 11,000 games were released on the platform — that’s more than 30 games per day.
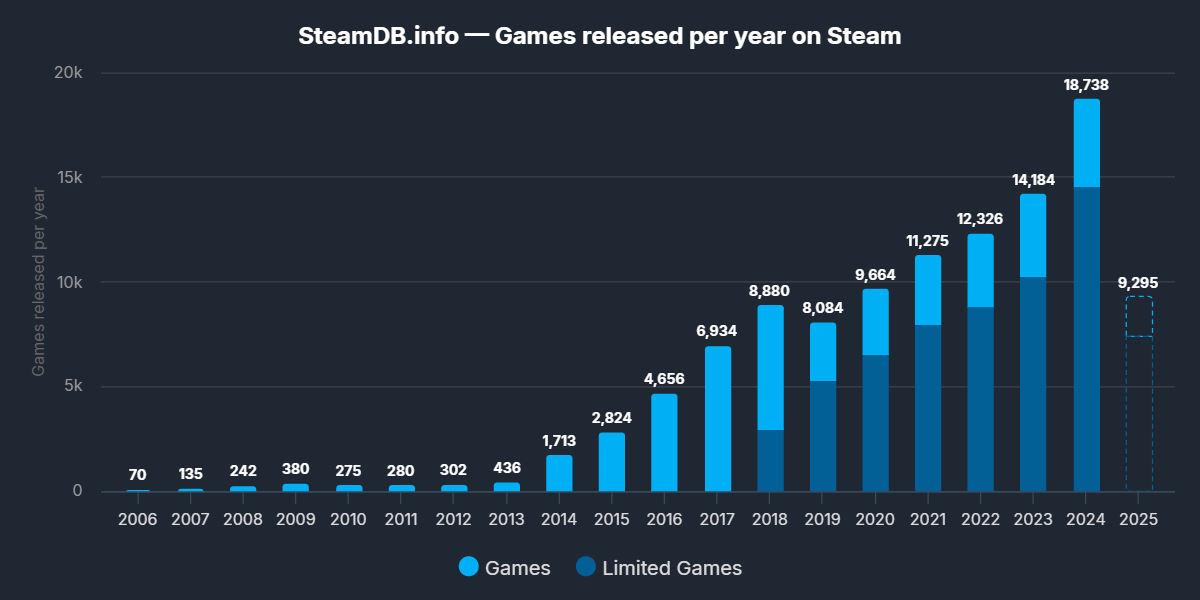
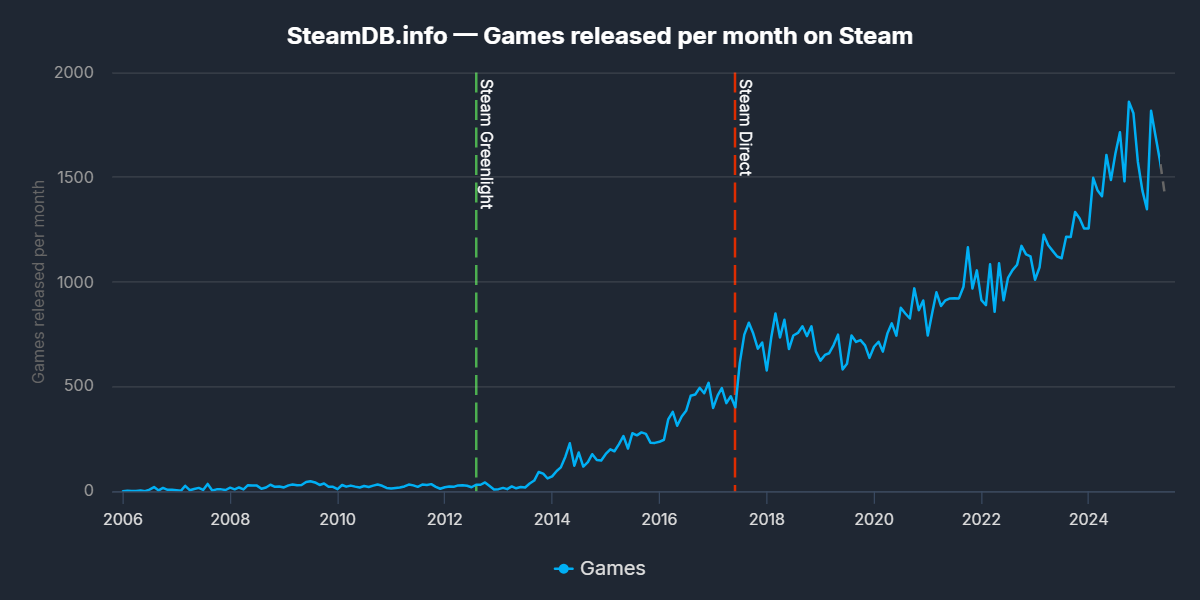
This deluge of content has created fierce competition for attention. For many games, even getting noticed is a monumental challenge. To focus on titles that have reached some degree of exposure, we narrowed our dataset to the subset of Steam games with a Metacritic page. These are titles that have drawn at least some degree of critic and user attention — a crucial step toward both commercial and critical success. But even within this more visible subset, the numbers tell a revealing story. While the absolute number of games with Metacritic pages has been steadily rising — nearly tripling since 2015 — their proportion relative to the total number of Steam releases has been declining.
The number of Metacritic pages for games has been increasing over the years
In other words, as the flood of new releases grows, fewer of them are breaking through to earn critical attention.
How players engage
Once a game is released on Steam, how do players actually engage with it? We examined three key signals: estimated ownership, average playtime, review counts, each revealing a different aspect of how attention and interest unfold. First, the total estimated number of owners has increased steadily over the years, showing that even as the platform grows more crowded, many games are still managing to reach players — often helped by bundles, deep discounts, or seasonal promotions. However, the gains are far from evenly distributed.
When we look at average playtime over time, a subtle but important shift emerges: newer games tend to see shorter engagement windows compared to older titles. Whether due to time constraints, the abundance of available alternatives, or changing player habits, it’s clear that player attention is fragmenting.
As the number of owned games increases, average playtime decreases
Some noticeable spikes in the data trace back to landmark releases. The peaks in average playtime seen in years like 1998, 2000, 2001, 2003, and 2004 align with the launches of well-loved classics like Half-Life, Counter-Strike, Half-Life: Blue Shift, Day of Defeat, and Counter-Strike: Source. These titles have maintained active player bases over decades, skewing the average upward. Similarly, the sharp rise in estimated ownership in 2013 is largely attributable to Dota 2, a free-to-play phenomenon that brought millions of players onto Steam and became a pillar of its ecosystem.
Finally, we explored review postings by looking at the distribution of the number of user reviews per game. The pattern here shows clear inequalities: most games receive very few reviews, while a select few attract thousands. This distribution — like ownership and playtime — reflects a highly competitive ecosystem, where visibility and player feedback are dominated by a small percentage of releases. Together, these trends reveal how player engagement is both growing and concentrating better explanation needed, offering opportunities for breakout hits, but also highlighting the steep climb most games face after launch.
The majority of games only receives a small number of reviews
Understanding how much a game is liked by players is not as straightforward as it might seem. As Fortuna Imperatore underscores,
"The recipe is very difficult to find, considering that a developer's impossible task is to respond to the needs of society at that historical moment."
Enjoyment and recognition cannot be condensed in a single number, but scores meant to summarise the quality of a game are readily available. On Metacritic, two scores are typically available: the critic score, based on professional reviews, and the user score, submitted by players. On Steam, the main visible indicator of satisfaction is the positive review ratio — the share of user reviews marked as “positive”. Caution must be exercised, however, when taking these numbers at face value. Critic scores tend to cluster around the higher end of a scale that ranges from 0 to 100. Reviewers often avoid the harshest ratings, leading to a compressed distribution with fewer low scores and a bias toward the 70–90 range. As Andrea Porta explains,
"This is usually the case because journalists can sometimes feel a significant responsibility when assigning a very low score to highly anticipated titles. Such a dynamic is very real and has deep roots within the video game critics landscape, which currently grapples with substantial financial challenges."
User scores, on the other hand, are more varied. Players are not shy about expressing dissatisfaction, resulting in a broader spread that includes more low-rated games. The contrast becomes clear when the two are plotted together; players are often harsher, and sometimes more polarised.
Users tend to give lower scores compared to critics
Then there’s the Steam positive ratio, which is quite different in nature. Steam reviews operate on a binary system —“thumbs up” or “thumbs down” — which strips away nuance and skews the distribution dramatically. Most games that gather reviews at all tend to be favored, so the ratio is heavily biased toward high values. In many cases, even moderately liked games can end up with “Very Positive” labels, suggesting that this metric alone might not capture the full spectrum of appreciation.
The positive ratio is not heavily influenced by the number of reviews left on Steam
These differences highlight the challenge of evaluating player sentiment in a consistent way. Each metric provides a piece of the puzzle, but none offers the full picture. This tension points to the need for more robust, composite measurements—an effort we take up in the next section, where we move toward defining appreciation and popularity as integrated, quantifiable outcomes.
Beyond the general trends, some games exhibit striking discrepancies between critic and user evaluations. In our dataset, we found a substantial number of titles where the difference between the two scores exceeds 20 points on a 100-point scale—sometimes even more than 30.
In some cases critics and users score are widely different
These outliers can reflect cases where critics and players approached the game from entirely different perspectives: technical polish vs. emotional resonance, innovation vs. nostalgia, or even divergent expectations shaped by marketing. Analyzing these outliers in more detail could offer valuable insights into the dynamics of reception — what drives such a divide, and what it reveals about the varying standards of professional reviewers and general audiences.
We have dived a little more deeply into this topic, by analysing game reviews for the top 15 games where critics’ and users’ scores differred the most.
In the case of games that have received more critic’s praise than user’s love, the most talked about category, gameplay, has received mostly negative mentions from users, even for games with plenty of positive critics mentions. Price and value for money is also a point of contention; looking at critics reviews, all games received mostly positive mentions with respect to this topic. For users this is the second most talked about topic, but in a decidedly negative perspective. It is also interesting to note that both critics and users had plenty of comments to make about technical issues, which are mostly negative; however, it seems that critics did not find these issues to be relevant enough to impact the game, while users might have had a different view.
In the case of games that have received more love from the users than from the critics, it is not surprising to see that most user comments are positive across all categories, however, it is more difficult to spot any obvious trend. For some games, like Cortex Command or Disney Pixar WALL-E, users and critics focussed their reviews on different aspects of the games altogether, demonstrating a differing interests in the game features. For other games, like 7 Days to Die or Knock-knock, it seems that users were far less harsh in their judgements compared to critics.
Measuring Success
With thousands of games released each year and player attention more fragmented than ever, relying on a single dimension to evaluate a game’s success is limiting. A high number of owners does not necessarily mean players enjoyed the experience; a strong review ratio might come from a niche but passionate fanbase. Conversely, a critically acclaimed title might fail to attract a meaningful audience. In such a complex ecosystem, success is multidimensional and it becomes crucial to disentangle its components.
To this end, we introduce two composite indicators: Popularity and Appreciation. These scores aim to summarise multiple attributes into meaningful, interpretable indicators. Popularity combines a game’s visibility, reach, and commercial uptake (through ownership, wishlisting, and review counts), while appreciation reflects how well a game is received once it’s played (via various types of ratings).
This dual-axis approach allows for a more nuanced understanding of a game’s position in the market: whether it is loved but overlooked, widely played but polarising, or among that group that is both popular and appreciated. In the sections that follow, we explore how these indicators behave, what patterns emerge, and what features seem to shape a game’s trajectory across these axes.
Popularity Score
Popularity in the gaming world is more than just raw sales. It’s a combination of visibility, engagement, and community presence. To capture this complex reality, we created a composite Popularity Score using data from both Steam and gaming databases like Metacritic and Backloggd. We identified ten core indicators of attention, ranging from how many people bought or played a game, to how often it was reviewed or recommended. These included:
- Player activity metrics like peak concurrent users (24h and all-time)
- Estimated number of owners
- Steam review counts (total and recommendations)
- Engagement on Backloggd (plays, backlogs, reviews)
- Number of critic and user reviews on Metacritic
Because these numbers can vary wildly between indie successes and AAA blockbusters, we applied a logarithmic transformation to scale them more evenly. Then, we used Principal Component Analysis (PCA) to synthesize these features into a single, unified score (which is then normalized between 0 and 1). This score doesn’t just tell us how many people bought a game. It reflects how visible, discussed, and socially present a game is in the gaming ecosystem.
The top 15 games according to our popularity score feature a mix of blockbuster titles and enduring multiplayer hits. GTA V leads the pack, followed closely by ELDEN RING and Cyberpunk 2077. Multiplayer staples like CS:GO, Left 4 Dead 2, and PAYDAY 2 show strong staying power, while narrative-rich games (Red Dead Redemption 2, The Witcher 3, Baldur’s Gate 3) and indie successes (Stardew Valley, Terraria) demonstrate the wide range of what “popular” can mean on Steam.
The median popularity of games by release year reveals how audience focus has evolved. In the late ’90s and early 2000s, median scores often exceeded 0.6, driven by landmark titles like Half-Life and Counter-Strike. But from 2006 onward, scores declined to around 0.35–0.45, reflecting the rise of digital platforms, indie games, and a fragmented attention economy. A slight uptick in recent years hints at pandemic-era engagement and viral hits, though overall visibility per title has diminished as the market expands.
Popularity of games is on average declining
Tracking each year’s most popular game outlines a parallel history of standout releases. Valve dominated early on, followed by a mix of cult hits (Psychonauts, Stardew Valley) and AAA blockbusters (GTA V, ELDEN RING). These games not only captured attention at launch but they remained culturally and playably relevant, setting them apart in an increasingly saturated landscape.
Appreciation Score
While popularity tells us which games are getting the most attention, appreciation is about how deeply players value their time spent. To distill that sentiment into a measurable score, we combined three distinct signals of game quality:
- Steam review ratio: a basic signal of user satisfaction
- Metacritic critic score: a curated, professional assessment
- Metacritic user score: broader public sentiment outside Steam’s ecosystem
We used Principal Component Analysis (PCA) to synthesize these variables into a single score (which is then normalized between 0 and 1), one that cuts through isolated metrics and offers a more holistic picture of how a game is received across communities. This approach lets us identify not just the most played games, but the most loved.
The top 15 most appreciated games highlight story-driven, critically acclaimed titles. Baldur’s Gate 3 leads, with classics like Half-Life 2, Portal 2, and BioShock close behind. Several entries from long-running franchises (Final Fantasy, Persona, The Elder Scrolls) appear alongside modern hits like Red Dead Redemption 2 and God of War. This ranking underscores how narrative quality, innovation, and lasting impact drive appreciation, regardless of release date.
Tracking the evolution of appreciation scores reveals how perceptions of quality have shifted in tandem with Steam’s growth. From the late ’90s through the 2000s, median scores remained high, reflecting a more selective release environment — where titles like Half-Life and Half-Life 2 weren’t just popular but deeply respected. The post-2010 period, however, saw a dip, particularly around 2014–2016, as the platform opened to a flood of indie games — some exceptional, many less polished. Yet from 2020 onward, appreciation begins a modest recovery, suggesting developers have adapted to a crowded market, and players to better filtering tools. Our two domain experts have different points of view on this matter:
"As the pool increases, the quality inevitably decreases on average. Then on Steam, all this is amplified because more and more unknown games are released, and this can lead to an average decrease in appreciation." - Andrea Porta
"For years, video game creators have responded to player's calls for elements like 'cutting-edge graphics' and other initially gratifying features. However, prioritizing these aspects has, at times, come at the cost of content depth and innovation." - Fortuna Imperatore
Appreciation of games is on average declining
Overlaying top appreciated games by year reinforces this: alongside AAA milestones like The Witcher 3 and Baldur’s Gate 3, we find greatly appreciated indies like Celeste, Hollow Knight, and Pizza Tower. These titles show that lasting impact isn’t tied to budget, but to originality, depth, and connection.
Appreciation-Popularity Plane
The scatter plot below positions games according to their appreciation (horizontal axis) and popularity (vertical axis) scores. With median lines dividing the space, four distinct profiles emerge. Games in the top-right quadrant — such as Red Dead Redemption 2 or The Witcher 3 — combine strong admiration with widespread reach. The top-left captures popular games with more mixed reception, while the bottom-right shows beloved titles with narrower appeal. The bottom-left hosts games that struggled to resonate broadly on either front. This quadrant framework helps decode the landscape of critical and commercial impact at a single glance.
The top 15 titles that excel in both popularity and appreciation reflect a compelling mix of blockbuster hits and standout indie successes. Games like Baldur’s Gate 3, GTA V, and Elden Ring dominate thanks to massive reach and critical acclaim. But beloved indies such as Stardew Valley, Hollow Knight, Terraria, and Undertale hold their ground, proving that emotional impact and craftsmanship can rival even the biggest AAA productions.
High popularity & low appercation games managed to draw substantial attention but not much love. Big budget titles like Battlefield 2042, Fallout 76, and NBA 2K21 rank high in visibility yet falter in player satisfaction, as reflected by significantly lower appreciation scores. The list is almost entirely dominated by large publishers, hinting at a recurring pattern: strong marketing and brand recognition can drive popularity even when the final product disappoints. It’s a stark reminder that hype alone does not guarantee lasting success.
High appreciation & low popularity games represent the hidden gems of the Steam catalog—titles that flew under the radar but struck a chord with those who played them. Mostly indie and niche productions, like Worm Jazz, Depixtion, and DERU - The Art of Cooperation, these games boast remarkably high appreciation scores despite modest popularity. Their presence suggests that while marketing power can drive visibility, creative vision and satisfying gameplay can build strong player loyalty, even without mainstream attention.
The bottom end of the popularity–appreciation spectrum paints a picture of titles that struggled to gain traction both commercially and critically. Games like Wild West Online and Shadow Harvest: Phantom Ops saw limited player interest and failed to win over those who did engage. Interestingly, many of these are smaller indie efforts or low-profile AA titles, suggesting either underdeveloped experiences or misaligned expectations.
Indie vs Non-Indie
While independent developers were virtually absent from the early 2000s Steam landscape, things began to shift dramatically in the 2010s. In 2010, only a quarter of the games with a Metacritic page were indie titles. By 2015, that share had soared past 66%, reflecting the growing accessibility of game development tools and digital distribution platforms.
Indie games on the market have been steadily increasing
At its peak in the mid-2010s, indie representation regularly accounted for over half of all notable Steam releases, a cultural and creative boom that brought forth titles now considered classics like Stardew Valley, Hollow Knight, and Celeste. Though recent years have seen a slight decline in their relative share (down to around 44% in 2023), indie games remain a driving force in shaping what we play and how we engage with games.
The data tells a clear story: indie games, once rare outliers, take a now an important share of the PC gaming market. But how do they stack up in terms of visibility and critical acclaim? We break it down next.
When comparing appreciation scores, our measure of how well-received a game is, indie titles have often outperformed their big-budget counterparts, especially in more recent years.
Indie games score better than non indie in terms of appreciation
Since 2010, median appreciation scores for indie games have remained steady, hovering around 0.70–0.76. In contrast, non-indie (or AAA) games have seen greater fluctuation and, in some years, lagged behind. By 2023, indie games achieved a median appreciation of 0.75, compared to 0.69 for non-indie releases. This suggests that while indie games might not always match AAA production values, they end up being more appreciated through different means.
While indie titles have increasingly gained critical acclaim they still lag behind in terms of popularity. Median popularity scores for indie games consistently trail those of non-indie releases across most years.
Non-Indie games score better than indie in terms of popularity
In the early 2000s blockbuster titles dominated the market. But even in more recent years (e.g., 2020–2023), the most popular titles remain overwhelmingly non-indie. Notably, however, some indie games have broken through this ceiling. Titles like Terraria, Hollow Knight, and Stardew Valley have not only achieved critical success but also popularity levels comparable to large-scale productions.
The notable spike in indie game popularity in 2008 can be attributed to a handful of highly successful titles released that year. Games like World of Goo, AudioSurf, Mount & Blade, and Defense Grid: The Awakening gained significant traction on Steam, reflecting both their innovation and increasing visibility for indie titles. With only nine indie games in the dataset for that year, these standout hits heavily influenced the median popularity score, pushing it above 0.5 (the highest for indie titles until 2022). This moment marks one of the early breakthroughs of indie games into broader public awareness during the digital distribution era.
Some indie games have achieved AAA-levels of popularity
The data gathered from our review analysis shines some light on the characteristics that set apart indie and non-indie games. An analysis of the number of mentions per topic shows that both users and critics look for slightly different things in indie games compared to non indie games. For example, story and narrative do not gather as many mentions in reviews of indie games, both of users and critics, as they do for non-indie games. Users in particular tend to comment more on the sound and music in indie games, generally with a positive connotation. Interestingly, although gameplay is always the most discussed topic in games reviews, the gameplay for the most popular indie games received more attention by users than the gameplay for the most popular non indie games.
Both in terms of gameplay and price and value for money users tend to share more positive comments for popular indie games than for popular non-indie games. Considering the higher price-point of non-indie games, it may be that users are more inclined to be pleasantly surprised by games that were less expensive; it could also mean that expectations for games coming from non-indie developers are generally higher and thus more difficult to meet or exceed.
Our data highlights a clear strategic advantage for indie games in terms of initial pricing. With an average launch price of $16.85, significantly lower than non-indie titles averaging $25.60 (and a median of $14.99 compared to $19.99 for non-indies), independent developers consistently offer a more accessible entry point for players. This lower barrier to entry is crucial in a competitive market, yet affordability alone does not guarantee market dominance; our figures show that non-indie games generally achieve higher popularity scores (averaging 0.448 versus 0.363 for indies) despite their higher price point.
This gap underscores the critical role of pre-launch marketing and has been confirmed by Andrea Porta:
"The communication window between a game's announcement and its release is pivotal for building hype and shaping initial reception, with larger studios expertly orchestrating content drops—from gameplay reveals to launch trailers—to capture and sustain consumer attention. Intriguingly, many independent studios are now adopting the same strategy, leveraging similar strategic trailer releases to amplify their reach."
This evolving marketing sophistication, coupled with their inherently competitive pricing, may well be key to how certain indie games carve out significant success within the overwhelmingly vast gaming landscape.
Steam tags analysis
Steam tags serve as the primary vocabulary of the platform’s discovery system. Whether applied by developers or players, tags capture everything from genre and theme to tone and mechanics. Analyzing these tags offers insight into what types of games capture attention — and which appeal most to players or critics.
A first look at Steam’s tagging ecosystem reveals the most common features and genres that define the platform’s catalog. The most frequent tags (Singleplayer, Action, Adventure, and Indie) reflect the foundational role of narrative-driven and independently developed games in Steam’s library. Tags like Atmospheric, Story Rich, and Great Soundtrack point to an emphasis on immersive experiences, while Multiplayer and Co-op signal the continued relevance of shared play. Meanwhile, 2D, Strategy, and Puzzle showcase the variety in form and mechanics that appeal to different gaming audiences.
The data reveals clear trends shaping today’s gaming landscape: immersive atmospheres and nostalgia-driven themes lead player interest, while adventure and indie genres dominate overall volume, highlighting both broad appeal and creative diversity. Visual styles range widely, with 2D aesthetics and varied perspectives thriving alongside niche approaches. Classic genres like puzzle and platformers maintain strong presence, complemented by popular sub-genres emphasizing skill and replayability. Singleplayer remains the dominant mode, though multiplayer and co-op offer rich social experiences. Narrative depth is highly valued, with players seeking agency and meaningful storytelling. Together, these insights show a balanced ecosystem where innovation, tradition, and player choice coexist to define successful game design.
A closer look to the genre and subgenres tags gives some preliminary insight on how they tend to change within quadrants. Particularly significant is the difference in the top subgenres switching between the quadrants HP-LA and LP-HA. Popular tags found in the HP-LA quadrant, such as FPS, Hack and Slash and Third-Person Shooter are not as common in games belonging to the LP-HA quadrant; here more niche tags such as Puzzle-Platformers and Shoot ’Em Ups take the lead in terms of frequency.
Use the tag explorer to find out the most relevant genres and subgenres in each quadrant
Although some patterns are emerging from the analysis of game tags, they are not enough to paint a comprehensive picture of what characteristics make a game popular or appreciated. To shed some more light on this fundamental question, we trained a predictive model.
Predicting Success?
Is it possible to predict the success of a game? More precisely, is it possible to predict it by using only pre-release features such as the number of wishlists, Steam tags or the launch price?
We attempted to answer this question by using a machine learning ensemble model called XGBoost. In particular, we modeled both popularity and appreciation predictions as a binary classification task with thresholds given by the medians of the two distributions. In order to interpret our results we leveraged SHAP, a python library. Should you be interested in more details on our predictive model, please head to the technical discussions part.
Predicting popularity
Digging deeper into what fuels a game’s popularity, some trends were revealed. A key feature in the predictive model is the wishlist count, which we adopted after a recommendation from Fortuna Imperatore. This tip panned out; adding the wishlist count to our popularity predicitive model boosted accuracy to more than 80% on our test set. When a game racks up high interest on platforms like Backloggd before launch, it is far more likely to become a hit — making early buzz being one of the strongest signals of future popularity.
Social and broad-appeal features also stand out. Games tagged with Multiplayer tend to perform significantly better, while those without it often suffer in visibility — suggesting that while not essential, social functionality is becoming a powerful norm.
The Strategy tag offers another interesting twist. Although it’s not especially common, when present, it often signals a bump in popularity — highlighting strategic depth as a niche but respected trait among players. Curiously, Singleplayer works in the opposite direction. It doesn’t guarantee popularity, but its absence almost always drags a game down. That suggests solo play isn’t a bonus — it’s a baseline expectation for many players.
Other features like Open World, Sandbox, and Online Co-Op all contribute positively, while broader language support also nudges popularity upward, reflecting the benefits of global accessibility.
Some tags are more situational. Games labeled Cute or Simulation tend to have unpredictable effects — sometimes helping, sometimes hurting — likely depending on execution or market trends.
Overall, the analysis shows that popularity is not just about having the right tags — it is about how and when they show up. Certain features give games a clear edge, while others only work in the right context.
Predicting appreciation
When it comes to what players really value, games with a high number of wishlist entries on platforms like Backloggd are not just popular — they are also more likely to be widely appreciated.
Another feature that stands out is the indie status. While the “indie” tag does not always have a massive global effect, it tends to quietly boost a game’s appreciation score when present. Players seem to reward originality, personality, and risk-taking — qualities more commonly found in the indie space.
Certain genres punch well above their weight. Strategy and Puzzle games, for example, consistently drive up appreciation, pointing to a player base that values thoughtful mechanics. The same goes for more playful tags like Cute and Funny, suggesting emotional tone can matter just as much as gameplay.
Accessibility also plays a subtle but important role. Games that support more audio and subtitle languages tend to be rated more favorably — a nod to the growing expectation for inclusivity.
Not all tags land well, though. The Walking Simulator label, despite including some standout titles, drags down appreciation predictions on average. It is a divisive term, and the model reflects that ambivalence. Similarly, the broad Adventure tag shows only a slight negative effect — perhaps because it is used so loosely that it dilutes player expectations.
On the brighter side, 2D and Fantasy genres contribute to higher satisfaction, hinting at an enduring love for stylized, imaginative worlds.
Interestingly, Multiplayer — a strong driver of popularity — plays only a modest role here. Players might enjoy social play, but appreciation seems to hinge more on creativity, clarity of vision, and emotional resonance.
Although our predictive model for appreciation was not as performing ad the popularity one, we were still able to achieve an accuracy of more than 70% on test data. In the end, it is not just what a game does — it is how thoughtfully it does it. Clever mechanics, attention to detail, and personality go a long way in winning players’ hearts.
Predicting both popularity and appreciation
When trying to predict success by considering popularity and appreciation at the same time, the complexity of the task yields a lower accuracy of 61% on the test set. Nonetheless, this was enough to learn some patterns. We present our results grouped into four possible outcomes.
Cold Reception: When Games Miss on Both Fronts (Low Popularity and Low Appreciation)
Some games fall flat on both popularity and appreciation. The clearest indicator is, again, a lack of wishlist interest. Games with low wishlist counts on Backloggd are strongly nudged into this underperforming category, highlighting the predictive power of early audience engagement (or lack thereof).
Multiplayer and singleplayer modes act as safeguards: their presence reduces the likelihood of a game landing in this low/low quadrant. Similarly, genre tags like Strategy, Open World, and Sandbox modestly buffer against total obscurity.
In contrast, Walking Simulator emerges as a risk factor. When present, it increases the likelihood of poor performance on both axes, possibly due to polarized expectations or unmet ambitions. Tags like Funny, Puzzle, and Colorful offer more subtle support — while their individual impact is small, their absence can signal trouble.
Ultimately, games in this group tend to lack standout qualities or defined audiences, often slipping through the cracks in both popularity and appreciation.
The Hype That Didn’t Land: Popular but Poorly Received (High Popularity and Low Appreciation)
These are the games that make noise but fail to live up to it. While not universally true, the SHAP values suggest a pattern: Multiplayer, Open World, and Simulation tags all raise the chance of a game being classified as high in popularity but low in appreciation. These features may drive interest or sales, but do not always translate into satisfying experiences.
Surprisingly, fewer supported languages also correlates with this quadrant — possibly pointing to rushed or under-localized releases. On the pricing side, expensive games (in the $50–$100 range) show a sharp uptick in SHAP value, implying that high cost might raise expectations and by consequence disappointment when those are not met.
Games with 2D, Indie, or Fantasy tags, however, are less likely to fall here. These often cater to more focussed audiences, where hype is better aligned with delivery.
Even critic reviews are dominated by negative comments
An analysis of the reviews of the top 15 games with high popularity but low appreciation corroborates these findings, showing that, across all topics, the amount of negative comments is large. This is true even for critic reviews, which tend to have a higher percentage of positive comments, particularly when dealing with popular games.
In essence, big games with bold features can still miss the mark. Popularity alone is not enough to secure lasting appreciation.
Hidden gems: Loved, but Overlooked (Low Popularity and High Appreciation)
This quadrant houses the hidden gems — games that win hearts, even if they do not win headlines.
Wishlist counts are typically low here, reinforcing their under-the-radar status. Yet genre and style play a key role in boosting their acclaim. Tags like 2D, Puzzle, Cute, and especially Indie are strongly associated with this quadrant. These are often smaller, more personal games that appeal to players despite lacking mass exposure.
Conversely, tags tied to scale — like Open World, Survival, or Online Co-Op — make games less likely to land in this category, as they typically appeal to wider audiences.
Localization plays a minor role, with fewer supported languages modestly increasing a game’s chance of being classified here. Likewise, mid-priced titles ($20–$50) are less common — perhaps suggesting that budget-friendly or unconventional pricing helps niche games reach the right players.
The reception of games in this quadrant is small but overwhelmingly positive
These games are proof that appreciation does not always follow the crowd.
The Holy Grail: a developer's dream (High Popularity and High Appreciation)
So what makes a game both loved and widely played? The SHAP data points to a few key ingredients.
First, the wishlist count shows its strength: games with high wishlist counts are pushed firmly into this top-right quadrant. Broader platform availability also plays a major role: the more systems a game launches on, the more likely it is to find both popularity and appreciation.
Genre-wise, tags like Strategy, Multiplayer, Singleplayer, and even lighter features like Funny, Rogue-like, and Puzzle contribute positively. These games combine reach with substance offering both involvement and rewarding mechanics.
Surprisingly, pricing in the $50–$70 range does not have a clear effect, suggesting that value perception is more nuanced at the top end.
In short, the most successful games blend genre depth, broad availability, and strong anticipation.
Conclusions
If there is one takeaway from our analysis, it is: there is no universal recipe for making a successful game. While our predictive models uncovered consistent patterns, like the strong influence of wishlist interest, the positive role of localization and accessibility, or the impact of some tags, they are not crystal balls. The models can detect statistical associations, not causal relationships. They help us understand what tends to matter, but not why or how it leads to success in every case.
Crucially, our findings show that success, whether measured as popularity and/or appreciation, can take many forms. AAA games, with their broad platform releases and marketing power, often dominate in popularity. But they are not always the most appreciated. In contrast, some indie games achieve high appreciation with far fewer resources.
Success in games, as in art, is multifaceted. And perhaps that’s exactly what makes this medium so exciting.